Diagnosis: cardiogenic shock, myocarditis
This patient presents with vague symptoms of dry cough, fevers/malaise – but the clinic picture did not fit the diagnosis of pneumonia (immunocompetent patient with community acquired bilateral pneumonia and sepsis). A troponin was ordered due to mild ST elevation on the ECG, and the result was elevated at 24.2. A bedside echo was performed to further delineate the etiology of the patient’s hypotension and to assess his volume status.
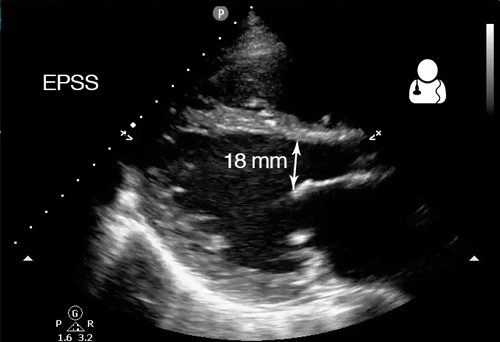
There are several key findings on these three clips: very low systolic ejection fraction (EF) is evident on the parasternal long axis cardiac view (PLAX), the multiple B-lines seen on this patient’s thoracic scan suggest interstitial pulmonary edema, and a very dilated inferior vena cava (IVC) that is nearly devoid of respiratory phasic changes suggests a very high CVP. The “bilateral pneumonia” was really pulmonary edema.
Take home points:
- Every patient with undifferentiated hypotension needs a bedside echo, better yet, a RUSH Exam.
- The gestalt estimation of cardiac function has been shown to correlate well with actual EF measurements,1 and emergency physicians can visually estimate EF nearly as well as cardiologists.2,3
- There are multiple ways to calculate an ejection fraction, from the simple approximation of fractional shortening to the most accurate (yet cumbersome to calculate) method of discs.
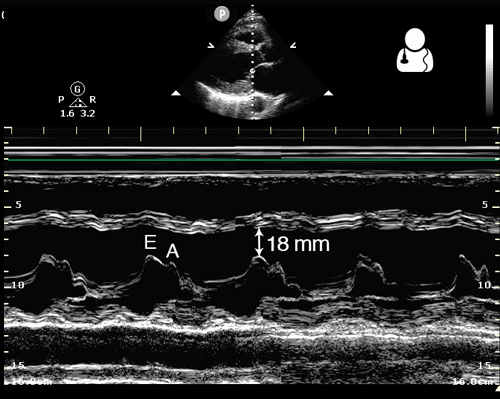
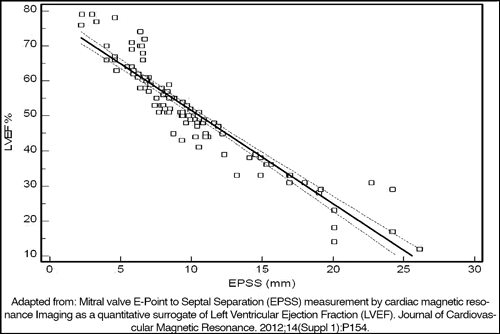
- One simple method to estimate EF is to measure the distance from the mitral valve to the septum in mid diastole. This is known as the E-point Septal Separation (EPSS), which correlates well with the EF in a structurally normal heart.4,5
- An EPSS < 7 mm is considered normal, while EPSS > 10 mm suggests a low EF.6 This measurement can be made more accurately when M-mode is used across the tip of the mitral valve in the PLAX view.
- Remember that significant mitral stenosis or aortic insufficiency can falsely increase the EPSS measurement, lowering your estimation of the patient’s ejection fraction.6


- Shahgaldi K, Gudmundsson P, Manouras A, Brodin LA, Winter R. Visually estimated ejection fraction by two dimensional and triplane echocardiography is closely correlated with quantitative ejection fraction by real-time three dimensional echocardiography. Cardiovasc Ultrasound. 2009;7:41. [PDF]
- Bustam A, Noor azhar M, Singh veriah R, Arumugam K, Loch A. Performance of emergency physicians in point-of-care echocardiography following limited training. Emerg Med J. 2014;31(5):369-73. [pubmed]
- Unlüer EE, Karagöz A, Akoğlu H, Bayata S. Visual estimation of bedside echocardiographic ejection fraction by emergency physicians. West J Emerg Med. 2014;15(2):221-6. [PDF]
- Mitral valve E-Point to Septal Separation (EPSS) measurement by cardiac magnetic resonance Imaging as a quantitative surrogate of Left Ventricular Ejection Fraction (LVEF). Journal of Cardiovascular Magnetic Resonance. 2012;14(Suppl 1):P154. [PDF]
- Mckaigney CJ, Krantz MJ, La rocque CL, Hurst ND, Buchanan MS, Kendall JL. E-point septal separation: a bedside tool for emergency physician assessment of left ventricular ejection fraction. Am J Emerg Med. 2014;32(6):493-7. [pubmed]
- Dawson, Mallin. Introduction to Bedside Ultrasound, Volume 2. 2013. Apple iBook. [iBook]


