Answer: Thoracentesis
This scan is a parasternal long axis view of the heart, obtained with a phased array probe. There is a mildly depressed ejection fraction, and no apparent right ventricular outflow dilation. There is a large anechoic fluid collection posterior to the heart. The differential diagnosis for this fluid includes pericardial effusion and pleural effusion.
- The important anatomical structure to identify here is the descending aorta, labeled Ao in this clip.
- A fluid collection that tracks posterior to the aorta, as it does in this clip, is consistent with a pleural effusion.1
- Compare the above clip with this clip:
- This clip demonstrates fluid clearly tracking anterior to the descending aorta, confirming the diagnosis of pericardial effusion.1
- If the diagnosis is still in question, it is useful to get a view of the fluid collection at the level of the diaphragm. Fluid directly above the diaphragm supports the diagnosis of pleural effusion. Here is our patient’s spleno-renal view with a large pleural effusion noted above the diaphragm:
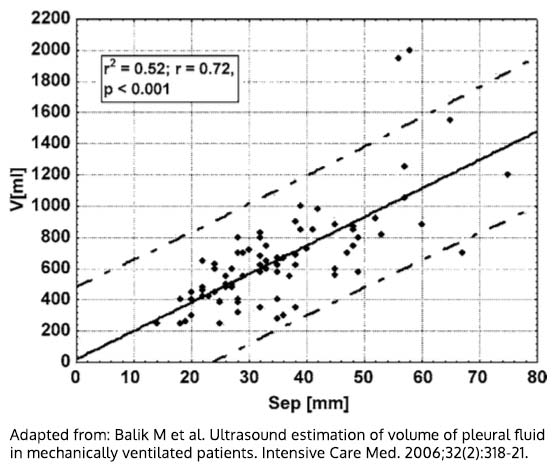
- The volume of pleural effusion can be estimated by measuring the maximum distance from the visceral to the partial pleura in millimeters (mm) and multiplying times 20. This yields milliliters (mL) of pleural fluid.2

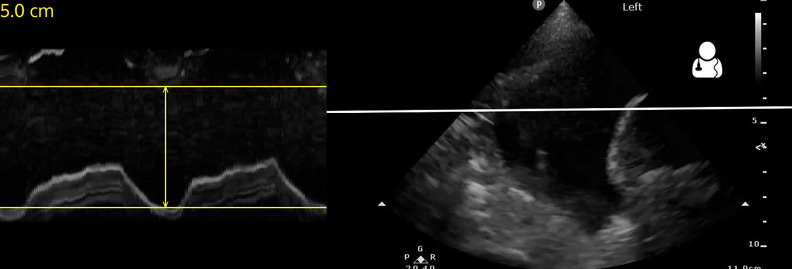
- Although this measurement is simple to perform contemporaneous with image acquisition, it can prove to be challenging post-hoc. However, the M.mode.ify tool makes short work of the task. Try it yourself with the above clip here.

- Using the M.mode.ify tool, it is clear that there is 50 mm between the visceral and parietal pleura, yielding and estimated pleural effusion volume of 50 x 20 ≈ 1000 mL.


